


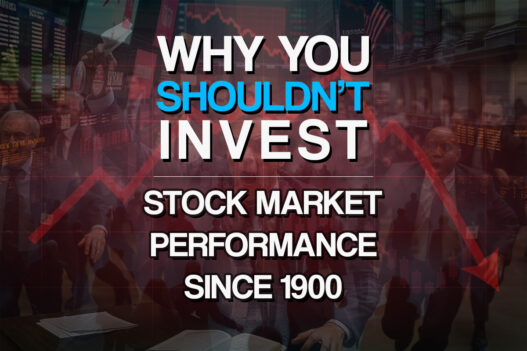
There's a reason you shouldn't invest in the stock market every year.
In the world of investing, fear is a constant companion. Every year, there's a fresh crisis screaming from the headlines: wars, recessions, pandemics, bubbles bursting—the list goes on.
These events make you pause, second-guess your portfolio, and think, I shouldn't invest right now. It's a siren song of caution, amplified by 24-hour news cycles and social media echo chambers.
Why risk your hard-earned money when the sky is always falling?
Buttttt… despite all those reasons you shouldn't invest, the stock market has marched on, delivering compound annual growth that has turned modest savings into life-changing wealth for those who stayed the course.
We're going to look at over a century of data, pairing annual Dow Jones Industrial Average (DJIA) performance (approximate price returns based on historical average closing prices) with the big, scary headlines that made “you shouldn't invest” the prevailing wisdom of the day.
The lesson? Major events happen, markets dip, but they recover—and often spectacularly—if you simply leave your money alone.
In other words, stop asking if you should pull your money out of the stock market when it starts declining.
We'll explore a comprehensive table of data from 1900 to 2024, highlighting how the market's long-term trajectory defies short-term panic.
By the end, you'll see why the mantra “you shouldn't invest” is not just wrong—it's a trap that keeps good people on the sidelines.
The Data: A Century of Crises and Comebacks
To illustrate this, I've compiled a table below using historical DJIA average closing prices to calculate annual price returns. I would've preferred to use the S&P 500, but since it wasn't introduced until 1957, it wouldn't have worked for the timespan I was aiming for.
These are not total returns (which include dividends and would show even stronger growth), but they paint a clear picture: Out of over 100 years, the market posted positive returns in most of them, with an average annual return of roughly 7.5% (excluding dividends) despite the chaos. When including dividends, the total return averages closer to 9.5% to 10%.
Look at the timespan performance in this chart, and then we'll see why you shouldn't invest each year.
The “Biggest Reason to Not Invest” column draws from historical events, crises, and prevailing fears that dominated news cycles each year. These aren't cherry-picked; they're the real headlines and worries that had investors whispering, you shouldn't invest—yet time and again, they were dead wrong.
The “DJIA Return (%)” column represents the annual rate of return for the DJIA, excluding dividends.
The “End Value of $100” column is how much you would have at the end of the year if you made a one-time investment of $100 in 1900, and never made another investment.
The “Year” column is… ok, you get it…
Here's Why You Shouldn't Invest (And Why You Must)
| Year | Biggest Reason to Not Invest | DJIA Return (%) | End Value of $100 |
|---|---|---|---|
| 1900 | Boxer Rebellion aftermath; gold standard debates | 7.01 | $107.01 |
| 1901 | Assassination of President McKinley (Sept 1901) | -8.7 | $97.70 |
| 1902 | Post-war slowdown & antitrust tensions | -0.42 | $97.21 |
| 1903 | “Rich Man's Panic”/1903 market downturn | -23.61 | $74.32 |
| 1904 | Russo‑Japanese War begins (global instability) | 41.74 | $105.34 |
| 1905 | Post‑war recovery; trust‑busting headlines | 38.2 | $145.58 |
| 1906 | San Francisco earthquake & fires (Apr 18) | -1.92 | $142.79 |
| 1907 | Panic of 1907 banking crisis | -37.73 | $88.91 |
| 1908 | Recovery from Panic of 1907 | 46.64 | $130.38 |
| 1909 | Ongoing recovery; tariff fight headlines | 14.97 | $149.90 |
| 1910 | Panic/Recession of 1910–11 begins | -17.86 | $123.13 |
| 1911 | Trust breakups (e.g., Standard Oil) & recession lingers | 0.39 | $123.61 |
| 1912 | Election uncertainty; Progressive Era reforms | 7.58 | $132.98 |
| 1913 | Income tax & Fed Act debates; pre‑WWI slowdown | -10.34 | $119.23 |
| 1914 | Outbreak of WWI; NYSE closes (Jul 31) | -30.72 | $82.60 |
| 1915 | War boom despite global conflict | 81.66 | $150.05 |
| 1916 | WWI intensifies; preparedness & election uncertainty | -4.19 | $143.77 |
| 1917 | U.S. enters WWI (Apr 6) | -21.71 | $112.55 |
| 1918 | Spanish flu pandemic; wartime economy | 10.51 | $124.38 |
| 1919 | Post‑war inflation/strikes; Red Scare | 30.45 | $162.26 |
| 1920 | Sharp post‑war recession begins | -32.9 | $108.88 |
| 1921 | Sharp post‑WWI recession continues | 12.74 | $122.75 |
| 1922 | Lingering deflation & economic slowdown | 21.71 | $149.40 |
| 1923 | Teapot Dome scandal; recession begins | -3.27 | $144.52 |
| 1924 | Coolidge election year uncertainty | 26.2 | $182.38 |
| 1925 | Florida land boom bubble fears | 30.06 | $237.20 |
| 1926 | General strike in UK; mild US slowdown | 0.34 | $238.01 |
| 1927 | Mississippi Flood; Fed eases credit | 28.74 | $306.41 |
| 1928 | Speculative bubble warnings | 48.22 | $454.16 |
| 1929 | Great Depression begins, stock market crash (Oct) | -17.17 | $376.18 |
| 1930 | Great Depression deepens | -33.77 | $249.15 |
| 1931 | Bank failures worldwide; Great Depression | -52.67 | $117.92 |
| 1932 | Worst year of Great Depression | -23.07 | $90.72 |
| 1933 | Bank holiday; FDR's New Deal begins | 66.69 | $151.22 |
| 1934 | Dust Bowl & slow recovery | -4.7 | $144.11 |
| 1935 | Social Security Act & recovery optimism | 38.53 | $199.63 |
| 1936 | Re‑election of FDR; war tensions abroad | 24.81 | $249.16 |
| 1937 | Recession of 1937–38 | -32.82 | $167.39 |
| 1938 | Recovery rebound after sharp recession | 28.06 | $214.36 |
| 1939 | WWII begins in Europe (Sep 1) | -2.9 | $208.14 |
| 1940 | France falls; Battle of Britain begins | -12.72 | $181.66 |
| 1941 | Pearl Harbor attack; U.S. enters WWII | -15.38 | $153.72 |
| 1942 | Early WWII losses; Battle of Midway turns tide | 7.59 | $165.39 |
| 1943 | WWII ongoing; war production economy | 13.85 | $188.29 |
| 1944 | D‑Day invasion; Allied advance | 12.13 | $211.13 |
| 1945 | FDR dies; WWII ends | 26.65 | $267.40 |
| 1946 | Post‑war inflation surge | -8.07 | $245.82 |
| 1947 | Cold War begins; Marshall Plan announced | 2.2 | $251.23 |
| 1948 | Berlin Blockade; Truman surprise re‑election | -2.13 | $245.88 |
| 1949 | Recession and deflation fears | 12.94 | $277.70 |
| 1950 | Korean War begins | 17.63 | $326.65 |
| 1951 | Korean War stalemate; inflation persists | 14.37 | $373.59 |
| 1952 | Election uncertainty; Eisenhower wins | 8.4 | $404.98 |
| 1953 | Korean War ends; recession | -3.77 | $389.71 |
| 1954 | Recovery; strong bull market | 44 | $561.18 |
| 1955 | Eisenhower heart attack | 20.78 | $677.79 |
| 1956 | Suez Crisis; Hungarian Revolution | 2.27 | $693.18 |
| 1957 | Recession of 1957–58 | -12.77 | $604.66 |
| 1958 | Recovery rebound | 34 | $810.24 |
| 1959 | Steel strike; Cold War tensions | 16.4 | $943.12 |
| 1960 | Recession & election uncertainty | -9.34 | $855.04 |
| 1961 | Cold War tensions; Bay of Pigs invasion | 18.71 | $1,015.02 |
| 1962 | Cuban Missile Crisis; ‘Flash Crash' (May 1962) | -10.81 | $905.29 |
| 1963 | JFK assassination | 17 | $1,059.19 |
| 1964 | Civil Rights Act; election uncertainty | 14.57 | $1,213.52 |
| 1965 | Escalation in Vietnam War | 10.88 | $1,345.55 |
| 1966 | Inflation concerns; credit crunch | -18.94 | $1,090.70 |
| 1967 | Six-Day War; Vietnam escalation | 15.2 | $1,256.49 |
| 1968 | MLK & RFK assassinations; Vietnam peak | 4.27 | $1,310.14 |
| 1969 | Vietnam War protests; recession begins | -15.19 | $1,111.13 |
| 1970 | Recession continues; Kent State shootings | 4.82 | $1,164.69 |
| 1971 | Nixon ends gold standard (Aug 15) | 6.11 | $1,235.85 |
| 1972 | Watergate scandal begins; Nixon re-elected | 14.58 | $1,416.04 |
| 1973 | OPEC oil embargo; Yom Kippur War | -16.58 | $1,181.26 |
| 1974 | Watergate resignation of Nixon; recession | -27.57 | $855.59 |
| 1975 | Recovery; end of Vietnam War | 38.32 | $1,183.45 |
| 1976 | Post-Watergate uncertainty; Carter elected | 17.86 | $1,394.81 |
| 1977 | Energy crisis; stagflation fears | -17.27 | $1,153.93 |
| 1978 | Inflation accelerates; dollar weakens | 2.72 | $1,185.31 |
| 1979 | Iran hostage crisis; second oil shock | 4.19 | $1,234.98 |
| 1980 | Inflation peaks; Volcker hikes rates | 14.93 | $1,419.36 |
| 1981 | Recession; Volcker's high interest rates | -9.23 | $1,288.35 |
| 1982 | Severe recession continues; unemployment peaks | 19.61 | $1,541.00 |
| 1983 | Recovery boom | 20.27 | $1,853.36 |
| 1984 | Deficit worries; Cold War tensions | -3.74 | $1,784.04 |
| 1985 | Plaza Accord; dollar volatility | 27.66 | $2,277.51 |
| 1986 | Challenger disaster; oil price collapse | 22.58 | $2,791.77 |
| 1987 | Black Monday crash (Oct 19) | 2.26 | $2,854.87 |
| 1988 | Market recovery; Iran-Iraq War ends | 11.85 | $3,193.17 |
| 1989 | Savings & Loan crisis; Berlin Wall falls | 26.96 | $4,054.05 |
| 1990 | Iraq invades Kuwait; recession | -4.34 | $3,878.10 |
| 1991 | Gulf War; recession ends | 20.32 | $4,666.13 |
| 1992 | Election uncertainty; sluggish recovery | 4.17 | $4,860.71 |
| 1993 | World Trade Center bombing; deficit reduction | 13.72 | $5,527.60 |
| 1994 | Bond market crash; Fed hikes rates | 2.14 | $5,645.89 |
| 1995 | Tech boom accelerates | 33.45 | $7,534.44 |
| 1996 | Greenspan ‘irrational exuberance' speech | 26.01 | $9,494.15 |
| 1997 | Asian financial crisis | 22.64 | $11,643.62 |
| 1998 | Russian default; LTCM hedge fund collapse | 16.1 | $13,518.24 |
| 1999 | Dot‑com bubble inflates | 25.22 | $16,927.54 |
| 2000 | Dot‑com bubble peaks; election dispute | -6.17 | $15,883.11 |
| 2001 | Dot‑com crash continues; 9/11 attacks | -7.1 | $14,755.41 |
| 2002 | Corporate scandals (Enron, WorldCom); Iraq war fears | -16.76 | $12,282.40 |
| 2003 | Iraq War begins; recovery starts | 25.32 | $15,392.31 |
| 2004 | Oil price surge; terrorism fears | 3.15 | $15,877.16 |
| 2005 | Hurricane Katrina; housing bubble concerns | -0.61 | $15,780.31 |
| 2006 | Housing market peaks | 16.29 | $18,350.93 |
| 2007 | Global credit crunch begins | 6.43 | $19,530.89 |
| 2008 | Global financial crisis; Lehman collapse | -33.84 | $12,921.64 |
| 2009 | Great Recession trough; recovery begins | 18.82 | $15,353.49 |
| 2010 | Flash Crash; Eurozone crisis | 11.02 | $17,045.44 |
| 2011 | U.S. debt downgrade; Eurozone crisis deepens | 5.53 | $17,988.06 |
| 2012 | Fiscal cliff fears; slow recovery | 7.26 | $19,293.99 |
| 2013 | Fed taper talk; government shutdown | 26.5 | $24,406.90 |
| 2014 | Oil price collapse; Ukraine crisis | 7.52 | $26,242.30 |
| 2015 | China slowdown; Fed rate hike | -2.23 | $25,657.09 |
| 2016 | Brexit; Trump elected | 13.42 | $29,100.28 |
| 2017 | North Korea tensions; tax reform | 25.08 | $36,398.63 |
| 2018 | Trade war with China; Fed tightening | -5.63 | $34,349.38 |
| 2019 | Trade war lingers; impeachment inquiry | 22.34 | $42,023.03 |
| 2020 | COVID‑19 pandemic crash & rebound | 7.25 | $45,069.70 |
| 2021 | COVID variants; inflation concerns | 18.73 | $53,511.25 |
| 2022 | Russia invades Ukraine; Fed rate hikes | -8.78 | $48,812.97 |
| 2023 | Banking turmoil (SVB collapse); AI tech boom | 13.7 | $55,500.34 |
| 2024 | High inflation lingers; Fed policy uncertainty | 12.8 | $63,103.89 |
| $66,259.08 |
Look at that table. It's a rollercoaster: massive drops from 1929-1932 amid the Great Depression, or -34% in 2008 during the financial meltdown. Each time, the headlines blared “you shouldn't invest”—war is hell, economies collapse, viruses spread.
Yet, scan the columns: for every brutal down year, there are clusters of roaring recoveries. The 1933 67% rebound? High positive percentages in 2009 and on for several years. A decade of double-digit gains.
Why the Market Always Bounces Back (No Matter How Bad It Gets)
The beauty of this data isn't in cherry-picking winners; it's in the pattern. Major events—be they world wars, oil shocks, or pandemics—feel existential in the moment. In 1914, World War I shut down the New York Stock Exchange for four months; investors thought you shouldn't invest ever again. By 1928, the market had quadrupled.
Fast-forward to 2020: COVID-19 wiped out a third of the market's value in weeks. Lockdowns, death tolls, supply chain Armageddon—you shouldn't invest, right? Wrong. The DJIA and the S&P roared back before the year even ended, fueled by innovation, stimulus, and human resilience. History shows recoveries average 3-5 years, but the key is patience.
Selling at the bottom locks in losses; holding captures the upside.
Consider the math. A $1,000 investment in 1900, reinvesting through every scary investing moment (using total returns, closer to 10% annualized), would be worth over $15 million today. That's not luck; it's compounding. Negative years happen (about 27% of the time), but they're dwarfed by the positives. The market's worst 20-year stretch since 1900 still returned +5% annually—beating inflation and bonds handily.
Just look at the $100 column put into a chart:
And those headlines? They're timeless. Stagflation in 1975? Don't invest. Dot-com bust in 2000? Don't even think about it! Even in boom years like 1999, Y2K loomed as the apocalypse du jour. Yet, the market doesn't care about your news feed; it prices future earnings, innovation, and growth.
Why We Fall for the “You Shouldn't Invest” Trap
Humans are wired for recency bias—we tend to catastrophize the latest crisis. Behavioral finance calls this the “availability heuristic”: vivid events like 9/11 or 2008 feel like they'll last forever, prompting us to bail. But data debunks it. Since 1900, the DJIA has survived two world wars, the Great Depression, 9 recessions, and countless scares—delivering positive returns in 75% of calendar years.
The real risk? Missing out. Studies show the average investor underperforms the market by 4-5% annually due to timing attempts. Every time the investing world seems terrifying, you're tempted to join the herd exiting at lows.
So, Should You Invest? Hell Yes—And Here's Why Now
Despite every reason you shouldn't invest over 125 years, the stock market has been the greatest wealth creator in history (I'll soon compare it to gold and real estate). It recovers from everything because economies adapt, companies innovate, and time heals. Wars end. Bubbles deflate, then inflate anew. Pandemics pass.
The best time to invest was 10 years ago. The second-best time? Right now. Dollar-cost average into a low-fee index fund, ignore the noise, and let compounding do the rest. In a world of endless “don'ts,” the data screams one big “do.”
The post Why You Shouldn't Invest: Stock Market Performance Since 1900 appeared first on MoneyMiniBlog.